Leeham News and Analysis
There's more to real news than a news release.

 Leeham News and Analysis
- Bjorn’s Corner: New engine development. Part 4. Propulsive efficiency April 19, 2024
- Boeing unlikely to meet FAA’s 90-day deadline for new safety program April 18, 2024
- Focus on quality not slowing innovation, says GKN April 18, 2024
- Boeing defends 787, 777 against whistleblower charges April 17, 2024
- Dissecting Boeing CEO’s statement next new airplane will cost $50bn April 15, 2024
Fundamentals of airliner performance; Part 7, the wing.
By Bjorn Fehrm
Introduction
April 28, 2015, c. Leeham Co. In our articles where we present an analysis of different airliners, we use a number of terms like aspect ratio, wetted area, etc and we assume that the reader understands what these terms mean and how they are defined. As will be clear from the description below, this is asking for a lot. Several terms which seem straightforward have a more complicated background and definition than what meets the eye.
It is, therefore, high time that we explain how these terms are defined and why we use them in the form they have. It might seem pretty clear what a simple term like wing area is. It should be pretty straightforward what one means and how this is measured, shouldn’t it? Nothing could be further from the truth. It does not describe the area of the wing (only), and there are several definitions of the term and different principles on how these are measured.
So let’s get started, and let’s demystify these terms and understand how they are used and why. We will start with the wing as this has the most terms that need to be explained. We will only touch on the most important definitions, those that we refer to all the time. For a complete understanding of the nomenclature of a modern airliner wing, there are several good sites on the internet and books on the subject.
Discussion
The wing and its most important parameters
We will start with the wing area as this is pretty fundamental yet more involved than one thinks. Wing area is important when the aircraft needs a maximum lift at low speed, such as during take-off and landing. Wing area is also used a lot in aerodynamic discussions and formulas. It is the major normalization parameter to make a comparison of wing characteristics between aircraft of different sizes possible.
It is a bit like the per-seat discussion when one talks about a cabin and the characteristics of a fuselage. Wing area serves the same purpose of enabling the comparison of e.g. the max lift per square meter of wing surface between e.g. the Boeing 787-9 and Airbus A350-900, even though these are not the same size aircraft. Such a parameter which is called the max take-off lift coefficient, Clmax-to, can then be compared between the aircraft, and one can reason why one or the other has a higher or lower value. It will be a measure of how well the designers have been able to match this parameter to the aircraft’s individual needs.
Wing area
Wing area, as presented by the OEMs, is actually not the area of the wing, it is more than that. The reason is that it serves as a reference to normalize the generated lift by the wing and aircraft as a whole. As can be seen in Figure 1, an aircraft’s wing generates a low-pressure area not only over the wing but also over the fuselage area between the wings.

Figure 1. Pressure distribution of Boeing 787 at cruise. Note the low-pressure area on the fuselage side generated by the wing. Source: Boeing.
This means that not only the wing area needs to be included in the normalizing area but also the aircraft’s fuselage area between the wings. How this is done differs between the manufacturers. We will now go through the different principles of measuring wing area and explain how it is done and why.
Trapezoidal definition

Figure 2. Trapezoidal definition of an aircraft’s wing area. Source: Leeham Co. Click to see better.
The traditional way to represent the area between the wings to capture the effect of the low-pressure area is to extend the lines of the leading and trailing edge of the wing until it meets the centerline of the fuselage, Figure 2.
This representation of the reference area bears on the fact that traditional wings did not have the straightened trailing edge, which extends from the mounting of the landing gear to the fuselage side, area Y in Figure 2. This extension, called the Yehudi, was added to ease landing gear integration in the wing root for low-wing airliners from the mid -1950’s. The Boeing 707 was one of the first examples. Apart from covering the landing gear leg, the Yehudi also increases the wing root cord, which allows the build height for the root to increase for the same wing relative thickness. This is useful as the wing has its highest stresses in this area; it is where the wing bending moment is at its highest.
Wimpress definition

Figure 3. The wingarea definition used by Boeing is called Wimpress. Source: Leeham Co. Click to see better.
Boeing, who was the first to include a Yehudi on an airliner with the 707, worked on how to improve the definition of the wing area.
The aerodynamic department with aerodynamicist Wimpress defined a more advanced definition shown in Figure 3, which modeled the effect of the fuselage low-pressure area better. As can be assumed, wing areas stated by Boeing follow the Wimpress definition and are quite different from wing areas which would be made with the classical trapezoidal definition.
Airbus definition
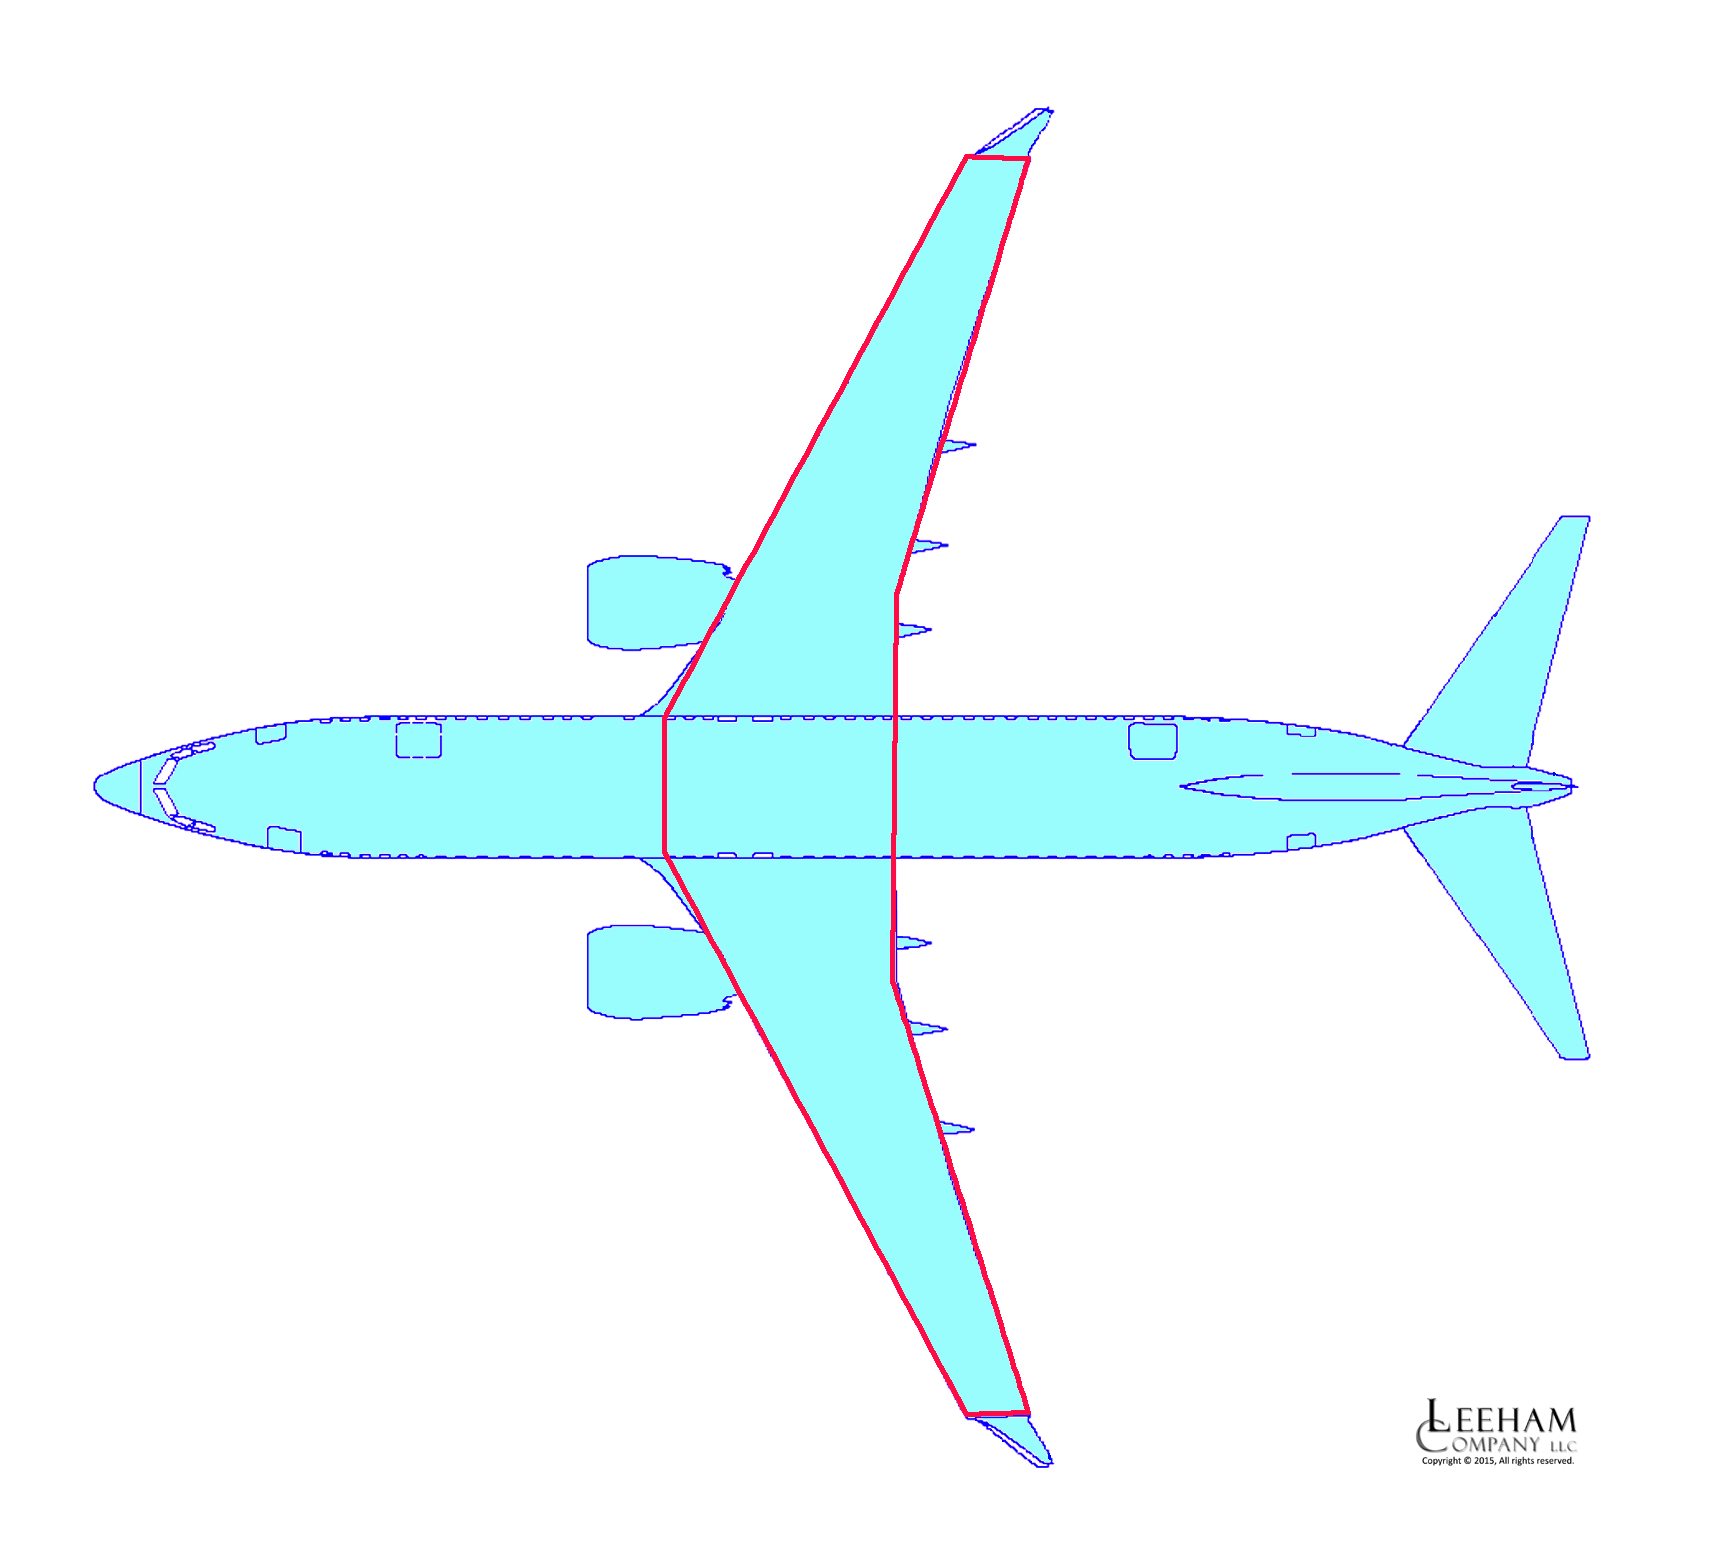
Figure 4. Wingarea definition used by Airbus. Source: Leeham Co.
Airbus went a simpler way. To represent the low-pressure area over the fuselage and the Yehudi, it connected the points where the Yehudi met the fuselage and cut the forward triangle straight of the classical trapezoidal area, Figure 4.
This is a definition that takes the existence of the Yehudi into account yet keeps a simple and easy-to-measure definition. If one deduces the area covered by the fuselage, i.e. wing root cord times fuselage width, one has the one-sided exposed wingarea, another important parameter for the wing, used for creating the wetted area of the wing.
As Airbus publicizes the wing area for all its aircraft and the definition is easy to measure and transform into the wing-wetted area, we use the Airbus method for all our measurements. It does not reflect any preference for Airbus’s way of doing things; it is simple practicality as it does not matter which one of the methods one uses as long as all compared aircraft are measured and compared with the same method. Wimpress might represent the wings pressure picture better, but it is rather involved to measure and generate.
Wing span and wingtip devices
The wingspan of an aircraft is a very important parameter for efficiency analysis as the span is counted twice in the formula for induced drag (it is squared). Extending the span of a wing to gain efficiency can run against limits like the airport gate limit of 65m for large twin-aisle aircraft like the 777 or A350. To extend the span further, one must then use either the vertical dimension for a winglet or go for a folded tip like the 777X. The importance of devices that extend the wingspan is understood when one realizes that an extension of the wingspan with e.g., 5% reduces the induced drag by 10.3%, the effect of the span extension is counted twice.
A standard wingspan is straightforward in its definition; it is simply the measurement between the wingtips. Things get more complicated when wingtip devices are added. How shall the effect of these be included in calculations that include wingspan, like calculation of induced drag or aspect ratio? These are dependent on the correct representation of the effect of the wing span with the wingtip device.
One of the more straightforward ways to include these effects is to define an “effective wingspan,” which includes the effect of the wingtip device. This method has the advantage of recognizing that the wingtip device is not there to reduce the wingtip vortices and thereby reduce induced drag. The vortices behind an aircraft are created by the wing in its entirety, where the wingtip device works with the rest of the wing to change the total pressure distribution of the wing and thereby reduce the strength of the total vortice field behind the aircraft, Figure 5.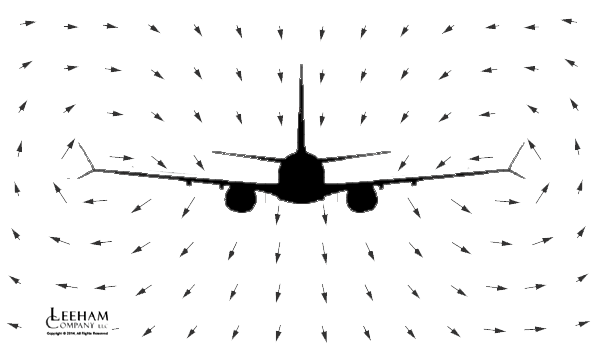
Anyone arguing the function of a wingtip device like a winglet by its influence of the wingtip vortices has not understood its function, one of the best descriptions of how it really works is done by Boeing’s Doug McLean in the document “Wingtip devices”.
We have, based on this and other research documents, developed a model of how wingtip devices affect the induced drag of an aircraft. This effect is then transformed into an “effective wingspan,” i.e., the wing with a wingspan that gives the same induced drag as the wing with a wingtip device. All formulas where wingspan is an important parameter by it work as normal with our values. This represents the true effect of a wingtip device on the aircraft’s efficiency (we also include the parasitic drag effect of the device in our modeling).
Aspect ratio
One of these formulas that we refer to often is the aspect ratio. It is a good dimensional figure of merit for a wing as a high aspect ratio describes a wing with low induced drag (drag due to weight) and which, at the same time, keeps the drag due to the friction of the air against the wings surface low as the wing area is relatively seen small for a wing with a high aspect ratio.
The original definition of aspect ratio is wingspan divided by the wings breadth or cord i.e., its width in the direction of the airflow. When wings get angled and have varying cords over the span, the original definition gets complicated to calculate, and it can be proven that wing span squared divided by wing area gives the same result.
We can now see that both our previously discussed parameters (effective span and wing area) are both included to generate the aspect ratio. To get a correct and comparable aspect ratio value between different aircraft, it is therefore important that the definition of the participating values are the same. This is seldom the case. Most of the time, aspect ratio numbers, for e.g., Airbus versus Boeing, are apples versus oranges, and conclusions drawn with one being better than the other being misleading.
Summary
There exist countless articles with tables of data over airliners where it is obvious that the compiler of the table has no idea what he is putting together. Wing areas of different definitions are freely mixed in the same comparison, and wing aspect ratios are made from these in-consistent areas and from wingspans without taking the effect of the wingtip devices into account. The result is a totally misleading concoct of “information” and conclusions. The cases where the information is correctly interpreted and compiled are rare.
The reason is that the definition of basic parameters is far more complicated than most compilers know or care to research.
In a future article in the series, we will look at further parameters that we use all the time to characterize aircraft, and that might require an explanation of how they are defined and why they are important.
Hi Bjorn, could you please do a part about aircraft stretching? Generally longer aircraft are considered more efficient. When should you go with wider fuselage, since stretching adds to much structural weight in the root to support heavier fuselage. Why do aircraft types start short, but then original version doesn’t sell well? e.g. 737, 777. Why didn’t this worked out for 767-400?
I see the 764 as a 9-11 victim. Wrong time/place. Prospected customers DL, AA and UA went into survival mode while they would order & Boeing terminated the program. Unlike the A330 it couldn’t carry industry standard LD3s, that didn’t help either.
Isnt the answer to why the 767-400 flopped three little numbers? ( Not 9-11)
330.!
Hi Kamil,
good idea. It will come, need to chew on it for a bit, in the meantime you got answer from others re 767-400.
“Such a parameter which is called the max take-off lift coefficient, Clmax-to, can then be compared between the aircraft and one can reason why one or the other has a higher or lower value. It will be a measure of how well the designers have been able to match this parameter to the aircraft’s individual needs.”
I don’t think this is a very useful without taking the different pressure distributions and resulting wing cross sections into consideration varying over the total wingspan, as well as boundary layers and drag effects at various flight phases, speeds and lift devices settings. And now we only taking the Lift function of the wing into consideration, its a fuel tank, landing gear stowage and engine carrier too..
😉 So many trade-offs. Wings are a great aerospace engineering topic.
Of course, the phrase was only there to tell why one place such an emphasis on wing area, it is a means to make everything else “per square meter”, i.e. independent on wing size, and when one does that it is important to use the same definition.
If an OEM present Clmax for a wing and he uses trapezoidal wing area to calculate it he will have a higher Clmax then one using Airbus or Wimpress wing area for the same wing.
I take it the pressure on the bottom of a wing is somewhat greater than standard atmospheric pressure. Based on my extensive research of holding my hand at an angle on road trips as a child.
I know that in buildings, direct pressure is about three times what leeward low pressure generates. What is the proportion of lift from the underside of the wing, versus the topside, if one could isolate the two?
On the A380, at the wingroot, at cruise angle, what is the difference in elevation between the leading edge and the trailing edge? It looks like the leading edge is about 3 meters higher. That is a massive amount of air being deflected downward by the undersurface of the wing.
I’d be interested to hear from someone who knows what they’re talking about on that one.Its certainly the other way around on a sailing boat(at least upwind)
An interesting aspect about the A380 wing box is that it was designed in order to minimise the “footprint” of the centre box in the fuselage; the length of which is the equivalent of 10 fuselage frames in the x-axis ( i.e. 10 x 0.635m; or 10 x 25″). In fact, the centre wing box on the A340-500/-600 is longer in the x-axis (i.e. 13 x 0.5334m; or 13 x 21″); or 6.35m on the A380 vs. 6.93m on the centre wing box on the A345/A346. Of course, the max. thickness of the entire aerofoil on the A380 is greater than the max. thickness of the A345/A346 aerofoil. In comparison, the length in the x-axis of the centre wing box on the A350 is the equivalent of 8 fuselage frames; or 8 x 0.635m = 5.08m.
In the link below, one can clearly see in the image, the tapering of the front spar on the A380 wingbox inwards of the inner engines and the huge amount of internal volume between the inner spar and leading edge.
http://www.ainonline.com/aviation-news/air-transport/2012-01-23/easa-orders-airbus-a380-wing-inspections
Can a tandem wing or biplane get the same span benefits as a largespan hi aspect ratio wing, with less structural weight?
Bjorn,
First of all, thanks for these “Fundamentals of airline performance” articles. I’ve enjoyed them all and they are a treat to read.
I’m curious for awhile now about how you deal with the sparseness of available data when using your aircraft performance model. While there is a lot of data out there, I would guess that much of it is not really all that useful, or not in a useful form.
Assuming that the model contains a good representation of the appropriate physics, it still needs to be baselined. Are there any baseline or “calibration” aircraft that you use for which you have a complete parameter set?
Also, when there are needed parameters that you cannot find, do you use the model to back out the missing parameters from reported performance data? My concern with this is that when the model is used in this way, any approximations in the model, or assumptions that may be off in certain flight regimes would introduce a double error if those backed out parameters are then used in performance predictions. While this concern might not be very significant for a basic “vanilla” airliner configuration, things might be different when trying to include the effects of the latest generation of wingtip devices of drag reduction devices such as HLFC systems.
Anyway, just some questions I had as someone who has to regularly deal with similar issues of data sparseness (when running hydrocodes). I greatly appreciate your willingness in these articles to give us readers glimpses into what you do with your model.
Hi Mike,
I have over the years collected a pretty solid set of data. In all the model contains around 800 parameters for each of 100 aircraft variants. Many are of course calculated parameters like effective span, wetted areas, different forms of drag, thrust and thrust lapse, SFC maps etc.
The trick is to make a model, then you know what data you are missing and looking for. You get data everywhere and 80% is not bona fide data as I describe, but with the model you know what is real and what is miss-understood data, you know what to keep and not.
You also know what say 0.5 tonnes of wrong OEW causes in terms of wrong predictions. Most data is readily available including performance data one can calibrate against (e.g payload-range charts). One of the tough ones are representative OEW’s, here Boeing is giving it in several forms with good definitions what it is and is not, Airbus, Embraer, Bombardier is not giving this data so you need to find it. It is available in other forms as everything is connected, just need to know what you want and how to get it. E.g. you get a ZFW and an payload, voila you have the DOW, then to take it to an OEW is not hard.
A big piece was operational cabins data, it used to be 10 parameters , today it is past 160 parameters for each aircraft variant. One just have to be systematic, then it is pretty clear what data you need and you find a way to get it.
Pingback: » Daily Aviation Brief – 05/05/2015