Leeham News and Analysis
There's more to real news than a news release.

 Leeham News and Analysis
- SPEEA, Boeing at impasse over safety program, union says April 23, 2024
- Better transparency needed on Boeing’s 1Q earnings call April 22, 2024
- Bjorn’s Corner: New engine development. Part 4. Propulsive efficiency April 19, 2024
- Boeing unlikely to meet FAA’s 90-day deadline for new safety program April 18, 2024
- Focus on quality not slowing innovation, says GKN April 18, 2024
Is Long-Haul LCC viable? Part 4
By Bjorn Fehrm
April 24, 2018, © Leeham News: In the third article about Long-Haul LCC and if it’s a viable business, we described the operational costs for typical aircraft used by a Long-Haul LCC.
We now look at the revenue side of the equation, including how much revenue we need to cover our costs and what variations we have over the year.
The Long-Haul LCC revenue
To understand the revenue a Long-Haul LCC can earn on a trip of the type we analyze (JFK to London-Gatwick), we need to understand how the willingness to travel varies over the year on such a route.
There are few Long-Haul LCCs which are active over the Atlantic and therefore not too much data to analyze. The data from legacy carriers are not relevant, as the customer types which are addressed differs.
The legacy carrier has a large percentage of business travellers, where seasonal variation is lower than for the leisure traveler the Long-Haul LCCs targets.
A leisure traveler will travel for the yearly vacation and in addition around the major holiday weekends. For the Christian world, this would be Christmas, Easter and the summer months June to September. As an example of such variations, we show In Figure 1 the monthly Revenue per flown Seat Kilometer (RASK) variation for Norwegian.
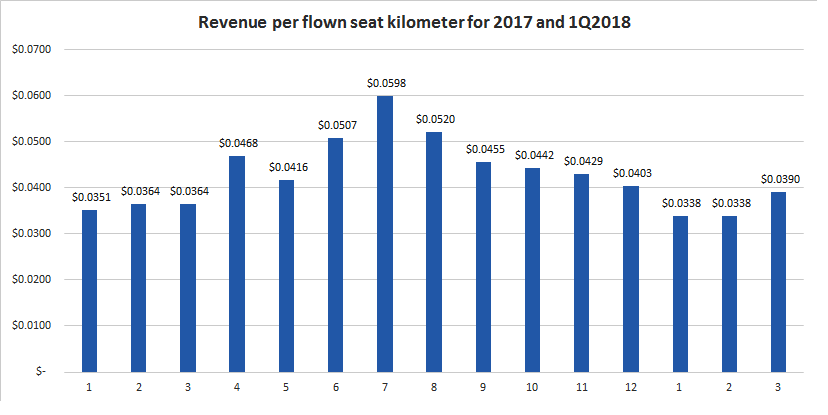
Figure 1. RASK for Norwegian during 2017 and for first Quarter 2018. Source: Norwegian and Leeham Co.
The RASK is the Revenue earned divided by the number of seats flown by the Norwegian fleet (both long-haul and short-haul) and the distance these seats fly. Multiply the RASK with the flown Available Seat Kilometer (ASK) and you have the revenue per month for the company for its flight operations.
From the graph, we can note the monthly variant of the revenue. There is a variation of almost two to one between the months. The best month is July, as expected, and the worst month is January.
The data includes both the Norwegian short-haul and long-haul flights. The long-haul fleet is approaching 50% of the produced seat kilometres for Norwegian during 2017. We could also see the seasonal variation has increased with an increasing long-haul operation. The long-haul passenger’s travel pattern is more seasonal than Norwegian’s intra-Europe traffic.
We can, therefore, assume the seasonal variation for a Long-Haul LCC like Norwegian will vary about plus/minus 50% around a mean, with the weak months in January/February and the peak in July.
The variation in revenue for the flights is not shown in a variation in load factor. We don’t have the load factor for the long-haul operation broken out of the overall load factor for Norwegian, but the overall load factors are around 95% for the peak summer months and 82%-83% for the January/February months.
Revenue management
The reason the load factors don’t vary more is that aggressive revenue management is used to fill the seats of the aircraft. The cost of flying the jets is there whether it transports passengers or not. The fuel costs in Figure 2 vary a bit with payload but this is marginal in the overall costs picture.
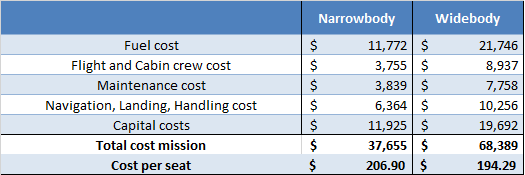
Figure 2. Operational costs when flying New York to London. Source: Leeham Co.
Revenue management divides the aircraft into seat buckets where the buckets are sold at different prices. The buckets have different price levels and they contain a different number of seats dependent on season and weekday. The prices and number of seats are governed by criteria like:
- How long in advance a bucket has to be booked (if it requires booking long in advance it’s cheaper).
- Does the bucket include a weekend or not (if it does, it’s cheaper)?
- How full is the flight x days before departure? If it’s for example 60% full 10 days before departure, prices go up or cheap buckets get smaller. If it’s the other way around the cheap buckets gets more seats allocated and smash deals might appear the last days.
- Departures from larger and more popular cities are sold at higher prices than if the ticket is booked for departure where the airline is not so well-known.
- And so on…
The overall principle is, it’s better to fill a seat than let it be empty, even if it’s sold at a bargain price.
The needed revenue
We know from our costs in Figure 2 we need an average revenue for the flights of $41,500 for the Narrowbody aircraft and $75,300 for the Widebody to break even. This includes the 10% company overhead for selling the tickets and managing the company.
We also know the revenue will have a seasonal variation which will look something like Figure 1. We will manage this with revenue management rather than leaving seats empty. Tickets will be cheaper in the off-season than for the summer months and around Christmas/New Year and Easter.
If we assume the route is daily and we strive for route break even in a first phase, we need a yearly revenue for the route of $15.2m for the Narrowbody and $27.5m for the Widebody.
This means we shall earn about $2m in peak months for the Narrowbody operation as there will be months where we will only earn $0.5m. For the Widebody, we need months with $3.5m as there will be winter months which only bring $1m.
So far so good. With the buckets its important to define how will it be sold, directly or as industry dictates, limit the number of buckets available to the GDS Systems to four or five. It all depends on how much it costs you to sell via the GDS Systems. The problem with selling directly is that you may not be known in the market, passengers in certain markets predominently purchase their tickets at travel agents or travel portals. You would be surprised at how many and which markets are not travel savy purchasers that buy directly with the airlines.
Nice exercise. We shouldn’t however downplay the most important variable while going after per seat costs. Seat capacity / airframe. Demand usually determines what aircraft buys / flies. RASM/ CASM/ CASK is all very nice. Fleetmanagement looks at how many seats they need for their network routes for the next 20 years.
Agree with the need for a specific type of aircraft with economics that support a LH LCC.
However any LH LCC coming to the market needs to worry about the here and now and the next 3 to 5 years not 20 years down the track.
Look how Ryanair started — flew the backwoods, didn’t fight big battles with the established carriers and worked their openings to the max.
If you fly it they will come — if the price is right.
Hi Bjorn, interesting read.
How do you obtain that the airline needs revenue of $2m in peak months and $0.5m in off-peak months? Is this a guess, as you believe the long-haul operation is more seasonal than shown in Figure 1?
If the revenue in off-peak months is so low, isn’t it better for the airline not to operate during these months? What are the considerations here? While the capital costs still need to be paid, variable costs (fuel, labour, etc.) could be saved. Per Figure 2, these represent two-thirds of the total mission cost.
Hi Patrick,
do the math. Take the average per month over the year and go 50% up and down and than add a little as the long-haul clearly is more seasonal than intra-Europe traffic. The RASK lows have not been so low for Norwegian before long-haul was added and what you see is only half the effect in the global figures in Figure 1.
Re quitting the route in the winter. In the US flight and cabin crew is paid per block hour, i.e. 100% variable pay. In Europe, this is not the case. Norwegians pay schemes (and for the other Long-Haul LCCs as there are no US ones at the moment) still have about 2/3 of the crew cost when the aircraft don’t fly. The same goes for the capital costs and crew + capital are around 40% of total costs. Further, you have a marketing negative from not flying a route the year through when you introduce a Long-Haul LCC.
Thanks, Bjorn, but I have two questions related to this article and this response. One, there was commentary by Mr. Kjos in the media that there would be U.S. based crews for Norwegian’s U.S. flying. So, how does this “fit” with your calculation on flight crew pay? And, two, while you’d have some higher incremental costs (marketing and gate costs immediately come to mind), couldn’t you switch to flying a more seasonally appropriate route? For example, switch to say, Gatwick—Fort Lauderdale for, say, November through April? P.S.
I haven’t found any evidence of US crews for Norwegian, could you give me a link if you found it. Further, I don’t think you can recruit crews with the prospect they’d be out of pay 4-5 of the year’s 12 months, there is an ever-worsening pilot shortage right now in the US. Re the route. We are talking about the off-season months, I think you find more travel to New York than Ft Lauderdale in January/February. But your point of more appropriate routes is good, there are and will be route changes during the winter. But the overall effect on revenue will be there, travel on the leisure dominated routes is down during several of the winter months and you have to change your revenue management targets.
At least Cabin Crew of Norwegian Long Haul (B787) are via OSM Aviation.
Their base is Miami.
For European LH-LCC a balance of networks to northern and southern hemisphere destinations could be the answer to success to vary the frequency and/or size of aircraft on routes on a seasonal basis?
Always wonder why Ryanair is not doing Transatlantic, maybe its about a single aircraft type. See BA looking at an 737-8ERX (4000Nm range), maybe things could change?
Hens coming home to roost?
https://www.flightglobal.com/news/articles/norwegian-transferred-six-on-order-787-9s-to-boc-avi-447837/
Dropping 6 x 787s and they are not a lease back, going to someone else.
Looks like something is going to happen with Norwegian?
http://c.newsnow.co.uk/A/935100870?-303:3665:3
Looking at the base data in the main diagram revenue varies from a top rate of 5.98 cents per revenue KM to a low rate of 3.98 cents per revenue KM.
Basic reporting measure that fails to take into account the split in the seating types within Norwegian long haul aircraft.
Consequently needs to move on to better understand their revenue generation and economics. However it is a data point and helps provide an understanding of the market.
Looking at your figures the seat ambiguity clouds the economics of the product offering being put forward.
You put the seat count at 182 — mixed business and economy and use this as your cost numerator.
However that does not properly define the situation as it mixes up the cost and revenue events of the aircraft — business seats take up more space but they generate more revenue.
Consequently a revenue multiplier and a density factor should be attached to any type seat beyond the standard long haul economy offering.
A321 = 200 economy seats at least.
Some layouts come up with 202 / 204 and the new exit arrangements should be able to increase this to 210 or 35 full rows.
210 economy seats = $179 per seat cost.
Now factor in a business class section — 16 = 4 @ 48” pitch.
Give the business class a revenue factor of 3 x economy.
Layout is now 16 business and 174 economy.
Revenue potential = 48 + 174 = 222 economy seats.
Cost per economy seat equivalent is now $169.62
Same game can be played with premium economy — 24 = 6 @ 40” pitch — and give it a revenue factor of 1.5.
Layout is now 16 / 24 / 144.
Revenue potential is now 48 + 36 + 144 = 228 economy seats.
Cost is now down to $165.15
Fair point that these are just the aircraft costs of the seats.
The hotel costs — free food / drink / services — need to be added to each seat type are appropriate but it offers a base to work from.
Main thing is that a LH LCC aircraft can be worked to maximise its revenue potential.
Why would Business want to use such a flight?
If the route structure — secondary cities to primary locations — can offer P2P benefits without the need to pass through busy hubs with awkward connecting flights.
Any thoughts on Trenton as a good airport for the NE?
Not sure if it currently handles international traffic but it is well located.
Economy — car hire or bus to the train station x 2.
Business — as above or a car to your location within 60 / 80 / 100 miles. You make your own way back?
Runnway is 1831m/6000ft.
This can’t handle an A321 at 97T for takeoff
Thanks for pointing out the schoolboy howler in my cunning plan — back to the drawing board.
Although …
A321 @ 2850 NM with wind assistance to Glesga / 170 passengers = 90T MTOW?