Leeham News and Analysis
There's more to real news than a news release.

 Leeham News and Analysis
- Boeing unlikely to meet FAA’s 90-day deadline for new safety program April 18, 2024
- Focus on quality not slowing innovation, says GKN April 18, 2024
- Boeing defends 787, 777 against whistleblower charges April 17, 2024
- Dissecting Boeing CEO’s statement next new airplane will cost $50bn April 15, 2024
- Bjorn’s Corner: New engine development. Part 3. Propulsive efficiency April 12, 2024
Bjorn’s Corner: Pitch stability, Part 2

By Bjorn Fehrm
November 30, 2018, ©. Leeham News: Last week we started a series on pitch stability of aircraft. It has actuality as the reason Boeing introduced the now well-known MCAS (Maneuver Characteristic Augmentation System) was to improve the pitch stability of the 737 MAX.
We discussed the pitch stability of the basic wing last week. This week we add the fuselage and see what happens.
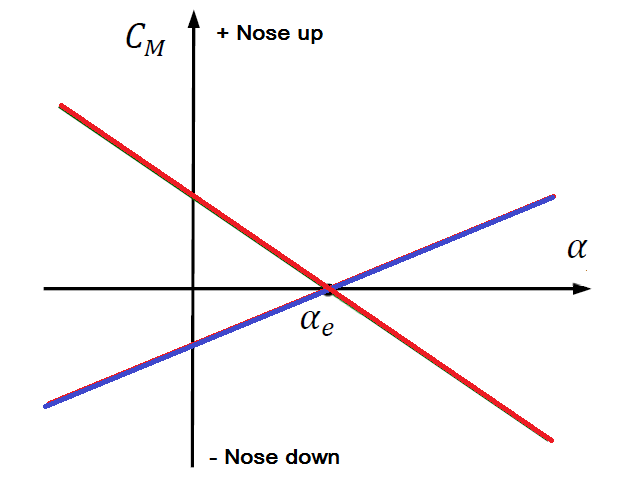
Figure 1. The pitch stability of two different wings, Violet (Classic profile) and Red (Supercritical profile). Source: Leeham Co.
Pitch stability of fuselage with wing
We could see the pitch stability of a wing could be both positive (the pitching moment around the center of gravity is decreasing with increased Angle of Attack (AoA)) and negative (an increasing pitch up moment with AoA).
We now add a fuselage to the wing. If we look at an airliner fuselage alone it’s destabilizing in pitch. It depends on where the center of gravity of the fuselage is, but if it’s at the middle it’s unstable. The reason is the flow over the rounded nose creates a low-pressure area directly behind the cockpit, Figure 2.

Figure 2. The pressure distribution for the Boeing 787 during cruise. Source: Boeing.
The light blue area directly behind the curved part of the 787 nose shows the airflow creating a low-pressure area on the top front of the fuselage at the typical cruise angle of attack of 3°.
We can also see a low-pressure area over the wing join with the fuselage. This is a spillover from the wing’s low-pressure and not generated by the fuselage in itself. Further back we have no low-pressure areas like on the front of the fuselage.
This is a pressure map of the 787 but other airliners look the same. Aircraft designers are carefully designing the nose curves to create as little low-pressure over the front of the cabin as possible. It creates a pocket of high airspeed (low-pressure and high airspeed go together) which often reaches supersonic levels, by it creating wave drag when the airflow goes back to subsonic flow after the area.
If we add a fuselage which has a strong pitching up moment to a wing which does not have a strong pitch down moment, the combination is unstable.
In Figure 3 the moment curve of the fuselage and wing of an early variant of what became the DC9 is shown. It’s a pitch moment curve which has been measured on a wind tunnel model which has the pitch axis at 40% wing chord.
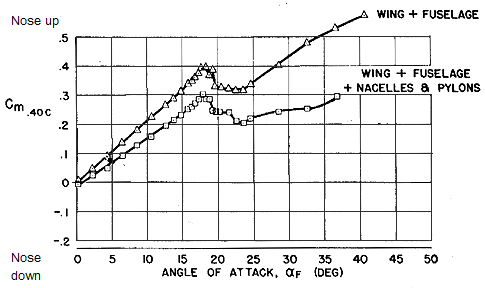
Figure 3. The pitch moment versus AoA for a DC9 type fuselage + wing. Source: Stanford University.
The combination is unstable. The nose up pitching moment increases with AoA for the reasons we discussed. The change of the curve at 17° AoA is interesting.
The classical wing profile of the DC9 candidate had a pitch up wing moment. When the wings stall, the suction peak at 25% wing chord collapses and the wing moment changes to pitch down. The area directly after a stall is stable (nose down with increasing AoA).
The combination is stable until 25° AoA when it pitches up again if the AoA increases further. The totally separated flow on the wing is once again not stabilizing in pitch.
The bump in the pitch moment curve as the flow around the parts changes shows the problems an aircraft designer is challenged with. The design has predictable characteristic in the flight envelope for normal use. But when approaching the extremes of the envelope, moment curves and lift changes and measures to handle the initial part of the curve must now be adapted to the new situation.
Note how the pitch up moment with increasing AoA decreases when horizontally protruding objects like DC9 style rear pylons and nacelles are added to the fuselage. These add aerodynamic area behind the Center of Gravity and this adds stability.
This curve has a lower angle. It means the pitch up moment grows slower than for the original curve.
In the next Corner, we discuss how we introduce a horizontal stabilizer to turn this unstable curve into a stable curve.
Firstly, thanks Bjorn for Bjorn’s corner! Always appreciate clear and concise but in-depth technical analysis.
I’ve always been curious as to why most (all?) large commercial aircraft today (B737 and bigger) appear to have a slight nose up attitude during cruise. Some of the reasons I’ve seen cited include customer comfort (feels more natural for a slight incline than decline) and/or to make use of lift that can occur from the fuselage. I was wondering if stability plays a role at all for having nose up attitude? Or if there are other reason(s)?
When designing an aircraft you strive for the best overall Lift versus Drag (L/D) at cruise for the whole aircraft. The fuselage will push air to the side creating form drag from any separations and also drag from increased airflow speeds as the air curves around the nose. I guess you might as well use this lower air pressure productively by letting the fuselage have a bit of AoA, by it having the increased airspeed focus the overside and get a bit of lift. You have to be careful as the fuselage has a lousy aspect ratio and will create a lot of induced drag if the AoA gets too high.
The need to have the fuselage fly at optimum AoA to optimise the L/D of the whole aircraft has led to the variable camber wings. At initial cruise the aircraft is heavy, which means the wing needs a higher AoA, say 4-5° instead of the mid weight 3°. This means you are now flying an inefficient fuselage at 4-5° as well. With a variable camber wing, you can get the wing to produce the lift needed for different phases of flight with the fuselage AoA at an optimum. The airframers say the cambered wing is there to optimize overall L/D. This is a key factor behind it (there are other factors as well as massaging the wing’s pressure distribution in span etc.).
What are the units of torque on the pitch, Cm, on the graph, noted as .40c?
Cm is a non-dimensional quantity. It is typically marked as [Rad^-1] or “per radian” implying it is unitless.
Comparing a large aircraft, say a 777, to this DC-9, what would define the same relative pitch stability, the same rotational acceleration?
I still don’t understand what this Cm is, .40c.
The “Stanford University” graph labels the y axis as “pitch moment”.
In engineering, moment is typically force times distance, except at Stanford?
Ted,
Cm0.40c is reflective of the pitching moment (force * distance) calculated around a selected point (in this case, the point is located at 40% of the mean aerodynamic chord, hence Cm 0.40c). In this case, this moment is divided by other terms (q*S*c_bar) to make it non-dimensional. This is a pretty standard practice in aerospace. The motivation for having these quantities be non-dimensional is to allow fair comparison of moments and forces (or their derivatives) for the same airplane across speed/altitude ranges and for different wing shapes. There is also a more subtle mathematical motivation.
A good metric for assessing and comparing the pitch stability between different airplanes is called the static margin (SM – also unitless). It is defined as the distance between the neutral point (the point along the length of the airplane where Cm, if calculated, goes to zero) and the length-wise location of center of gravity, divided by the mean aerodynamic chord length of the wing. SM is a fraction, often expressed in %. Two airplanes with a +15% SM, stabilize in pitch in a similar manner. An airplane with a negative SM would be unstable in pitch, and an airplane with SM of zero is neutral and does not self correct in pitch. There are other parameters that could be compared, but SM is a good one.
Yes, thanks for that explanation.
I wonder what the difference in the SM between the NG and the MAX is at 10degree to 20 degree AOA?
Ted,
I can speak to approximate trends based on intuition and basic aero: 737 MAX would have a reduced SM compared to NG at both 10° and 20° AOA due to the larger nacelle forward of the neutral point. The MAX nacelle geometry is more bulbous than the NG and therefore would generate more lift at higher AOAs. I expect the SM to drop more at 20° vs. 10° AOA for MAX vs. NG.
It is possible to estimate these quantities somewhat accurately using publicly available data and software specializing in this type of analysis. Typical SM values quoted for commercial aircraft at cruise (benign AOA, less than 3°) is 10-15%, lower SM values are typical for more modern commercial airplanes with relaxed stability.
Ted,
Cm denotes a dimensionless quantity called the Moment Coefficient. The Moment Coefficient for a finite wing is related to the pitching moment by the following relation,
Cm=M/(q*c*S)
where M is the pitching moment, q is the dynamic pressure, c is the mean chord length of the wing ( average distance from wing leading edge to trailing edge), and S is the wing area.
The dynamic pressure is further related to the free stream (flight) velocity and air density by the following,
q=(1/2)*rho*V^2
where V is the free stream velocity and rho is the air density.
Whenever a moment (or Moment Coefficient) is defined or measured, it needs to be defined or measured around an axis. In the case of the DC9 data that Bjorn sourced from Stanford, the Moment Coefficient was measured around an axis located 40% of the mean chord length back from the average leading edge position of the wing (remember the wing is swept and tapered).
I hope this helps.
Yes that does, especially the 40% note. Thanks
Does the area of the fuselage, nacelles, or pylons factor into the denominator, or is that caught in the calculation or measurement of the pitching moment M?
That is a great question because the appropriate choice of the area, S, depends on what is to be measured. For example, the length squared, instead of an area, is often used to normalize the lift or the pitching moment for bodies of revolution such as the fuselage by itself. For wave drag it would be the cross-sectional area, and for skin friction drag, it would be the wetted area.
Since the issue being discussed in this article is pitch stability of the entire aircraft, only the wing area is typically used for normalization because the wing typically dominates the lift and pitching moment. In the end, the choice of normalization area comes down to convention.
Anchorage has a 7;l0 quake a few miles North, most of everything infrastructure wise (99.9% did fine, some localized road damage and a few broken water lines.) Airport was closed while they assessed but is back open.
Keep in mind that a commercial jet aircraft has a reverse curve wing.
Dynamics a bit different than the basic and you Always need a bit of angle to overcome the drag anyway (not sure what it is on a standard aircraft, not much)
I don’t think nose up has anything to do with stability.
Keep in mind that a commercial jet aircraft has a reverse curve wing.
Dynamics a bit different than the basic and you Always need a bit of angle to overcome the drag anyway (not sure what it is on a standard aircraft, not much)
I don’t think nose up has anything to do with stability.
Anchorage has a 7;l0 quake a few miles North, most of everything infrastructure wise (99.9% did fine, some localized road damage and a few broken water lines.)
Looking forward to the introduction of the horizontal stabilizer in the next chapter.
So, ideally, would it be better to have a set of movable canards mounted at the place where all the action is,at the front of the nacelle?Is there also trouble with the nacelle messing up the airflow on the wings upper surface at high AOA?