Leeham News and Analysis
There's more to real news than a news release.

 Leeham News and Analysis
- SPEEA, Boeing at impasse over safety program, union says April 23, 2024
- Better transparency needed on Boeing’s 1Q earnings call April 22, 2024
- Bjorn’s Corner: New engine development. Part 4. Propulsive efficiency April 19, 2024
- Boeing unlikely to meet FAA’s 90-day deadline for new safety program April 18, 2024
- Focus on quality not slowing innovation, says GKN April 18, 2024
Bjorn’s Corner: Pitch stability, Part 3

By Bjorn Fehrm
December 7, 2018, ©. Leeham News: Last week we looked at the pitch stability of an aircraft wing with fuselage. We could see the combination was unstable. Now we add a rear wing called a horizontal stabilizer to get the whole aircraft stable in pitch.
We use the DC9 as our example of a pitch stable airliner (Figure 1) as it has some interesting pitch stability problems outside the normal flying envelope. This we will discuss in coming Corners.
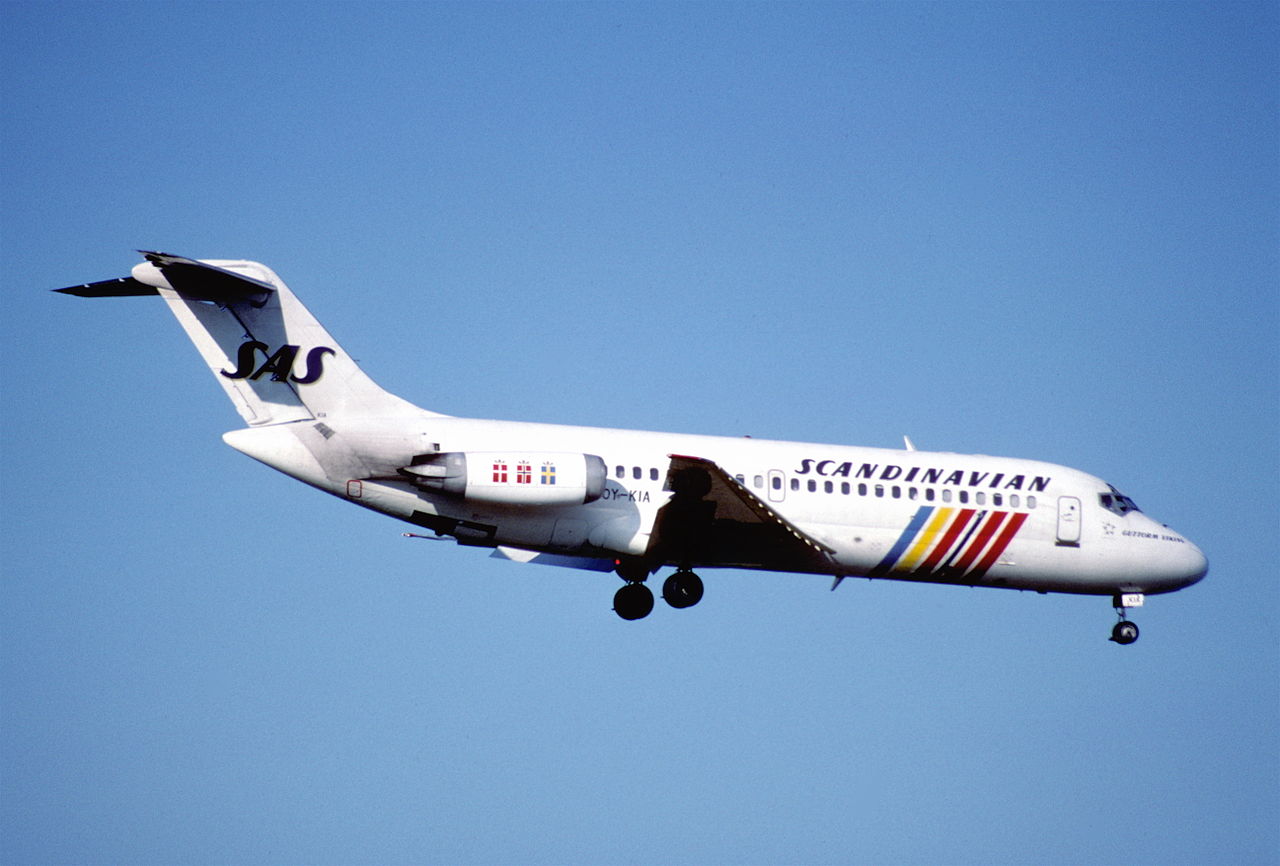
Figure 1. The DC-9, the airliner we use to study pitch stability. Source: Wikipedia.
Pitch stability when adding a stabilizer
Figure 2 shows the pitch moment curve we discussed in the previous Corner. It shows the pitch moment around a point at 40% of the wing’s chord (actually the graph shows the Pitch moment coefficient curve over Angle of Attack (AoA). See the comment section of the last Corner for good explanations of the difference). The moment curve is measured in a wind tunnel on a model of what eventually became the DC9.
The combination is unstable, the pitching moment nose up increases with AoA for the reason we discussed in the last Corner.
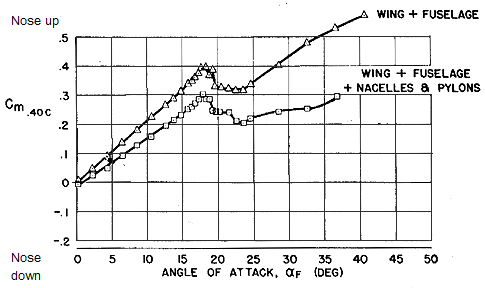
Figure 2. The pitch moment versus AoA for fuselage + wing. Source: Stanford University.
Now we add an aerodynamic surface behind the center of gravity, which is the point around which an aircraft moves. This surface is called a horizontal stabilizer. This surface, sitting well back from the center of gravity, will add stability to the pitch moment curve by adding a nose up or down moment depending on what is needed to control the pitch moment of the aircraft.
A horizontal stabilizer is placed as far back on the aircraft as possible, by it increasing the moment arm from the center of gravity for the stabilizing forces. The combination of the long moment arm and the force from the tailplane turns the curve to a stable pitch moment curve between 0° and 17° ° Angle of Attack (AoA), Figure 3.
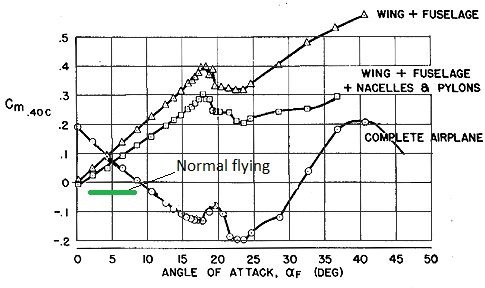
Figure 3. The pitch moment versus AoA for fuselage + wing + horizontal stabilizer. Source: Stanford University.
Normal flight with a clean aircraft (no slats or flaps) is flown between 2-4° at cruise and up to 6-8° in a turn or when waiting for landing at moderate speed in a circling pattern. There is, therefore, ample margins to the area of the curve where the pitch stability is turning neutral (the curve is horizontal) at 18° AoA. Above 18° the curve has a positive gradient, the aircraft is unstable in pitch. Then it turns stable until 23° and then unstable again.
We will discuss this undulating part of the curve in a following Corner. Now we focus on the normal flying range, the curve below 17°.
If we sum all parts of the aircraft producing lift into one point, this is called the Center of Lift, Figure 4. The figure shows the probable location of the center of lift for a DC9 type of aircraft. Its location is a bit behind the aircraft’s Center of Gravity.
A good way to estimate where an aircraft’s center of gravity is, is to look where the main wheels are placed. The center of gravity is placed just ahead of the main wheels to not have the aircraft tip on its tail when loaded. The center of gravity cannot be placed too far from the main wheels, however. Then a very large force is required from the horizontal stabilizer’s elevator to rotate the nose up when taking off.
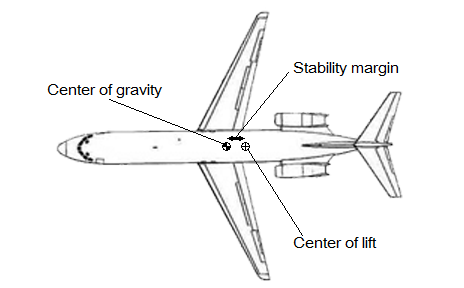
Figure 4. DC9 with center of lift and gravity. Source: Leeham Co.
The Center of Gravity being ahead of the Center of lift means the aircraft’s horizontal stabilizer is angeled against the airflow until it produces a pitch moment to balance the nose down moment created by the Center of Gravity being ahead of the Center of Lift. In this case the pitch moment is nose up.
This enables the aircraft to fly straight ahead at cruise. The position of the tail to create this moment equilibrium is called the trim position. The aircraft is in trim, flying at a constant altitude, with a constant pitch angle.
Any disturbance like a gust increasing the AoA on the wing will increase lift on the wing but also on the stabilizer. This will produce less pitch up moment from the stabilizer and the aircraft will turn nose down to return to stable flight. The aircraft is stable.
The equilibrium of pitch moment around the aircraft’s center of gravity will change as we change the aircraft’s speed. How and why we will discuss in the next Corner.
DC 9 aircraft on the British register had a couple of modifications to change the pitch stability of the aircraft.
One was a weight on a lever so arranged that, under high g conditions, it acted to pull the control column forwards to prevent a high angle of attack (increase the stick-force-per g). I guess it did something similar to the MCAS on the 737-8Max that has been in the news lately except that it had no AoA input and no computers, just mass and g-loading.
The other mod was a stick pusher. I guess that was driven by AoA. It overrode the pilot. The Fokker 100 had one too.
I guess the UK CAA saw the above graph, or one very like it, and decided they didn’t want the aircraft anywhere near that instability above 22 Degrees AoA.
The British had had bad experiences with BAC 1-11 and Trident aircraft, probably explains a lot of it.
So in trying to understand this, the longer they made this DC-9, and ultimately the MD-80s, the better it performed on the pitch stability front.
I’m trying to understand the graph between 0 and 8 degrees with a positive Cm. Is that for a postion on the tailplane with a given downward incidence of 8 degrees or so, fixed throughout the graph?
Without an explanation of the graph, I would have assumed that positive Cm values are a measure of tendency to nose up (pitch unstable, increasing AOA), and negative Cm as nose down (pitch stable, self correcting AOA). But you are saying it is the slope of the graph?
I assume pitch stability is a measure of the rotation to self correct nose down. On the graph at 15 degrees the self correction is Cm -.1 nose down, at 22 degrees the Cm is -.2 nose down, twice the pitch stabilizing coefficient at work?
Like you noticed, there is no information presented that states the specific position (re. pitch) of the tailplane. However, that info is irrelevant in this case because it should be understood that AoA in this graph is measured relative to chord of the main wing. Thus, like you surmised, the position of the tailplane is fixed throughout the graph.
Pitch stability is indeed dependent on the slope of the Cm vs. AoA curve and not whether the actual Cm values are positive or negative. As an example from the graph, if this aircraft is flying at an AoA of 4 deg, the Cm is positive (0.1), driving the nose up. Because the moment is driving the nose up, the AoA will increase, which will decrease the positive pitching moment because the slope is negative. This process of increasing the AoA along with the corresponding decrease in the pitching moment will continue until the AoA reaches about 8.5 deg, at which point the pitching moment is zero and the aircraft is considered to be trimmed in pitch.
Conversely, if the aircraft is initially flying at an AoA of 14 deg, the Cm is negative (-0.1), driving the nose down. This will decrease the AoA and also the MAGNITUDE of the negative pitching moment until the AoA is again at about 8.5 deg and the aircraft is in trim. Again, this only happens because the slope of the Cm vs. AoA curve is negative.
A Cm vs. AoA curve with a negative slope means that the pitching moment is always trying to bring the aircraft into the trim (equilibrium) condition. This is stable. A positive slope means the pitching moment is always trying bring the aircraft away from trim condition. This is unstable.
We were taught that in school, but we did not get into the math.
All we needed to know was we had stability. Nose dropped, speed went up, nose went up.
Same thing with hose up (without a elevator change ) slow down, drop down.
Too old to try to bend my brain around the math. Though it is most interesting.
Good planes are stable bad ones are not!~
“Good planes are stable bad ones are not!~”
What? F-16 is a great plane!
I figured that was coming.
There is now a sub category of aircraft (Fighters, maybe the B2 Flying wing) that are inherently unstable.
For 99.99% of humanity stable aircraft are what we want!
B2 without a tail is directionally unstable as well.
My favourite little plane, piaggio Avanti, used innovation in design to have 3 separate control surfaces, the foreplane technically not a carnard. The overall result is smaller sized wing and lower drag. The wing area being the same as a Cessna 172 and gives 90 kts higher speed than similar powered King 250.
https://www.flyingmag.com/piaggio-avanti-is-strange-but-great
Interesting artifact, the 3 surface business jet that Beech should have built rather than the canard Starship
https://en.m.wikipedia.org/wiki/Scaled_Composites_Triumph
And don’t forget the awesome F117A “Wobblin Goblin”! (Take that, Baghdad! LOL)
Do we get to see the Cm vs. AOA graph of the 737-800 and MAX 8 for comparison? And a 737-900er to see if the longer moment arm on the tail is noticeable.