Leeham News and Analysis
There's more to real news than a news release.


Bjorn’s Corner: Air Transport’s route to 2050. Part 24.
May 30, 2025, ©. Leeham News: We do a Corner series about the state of developments to improve the emission situation for Air Transport. We try to understand why development has been slow.
We examined alternative, lower-emission propulsion technologies three weeks ago and compared them to the industry’s typical improvement in fuel consumption over time the following week. Last week, we examined the improvements that SAF can offer by 2050.
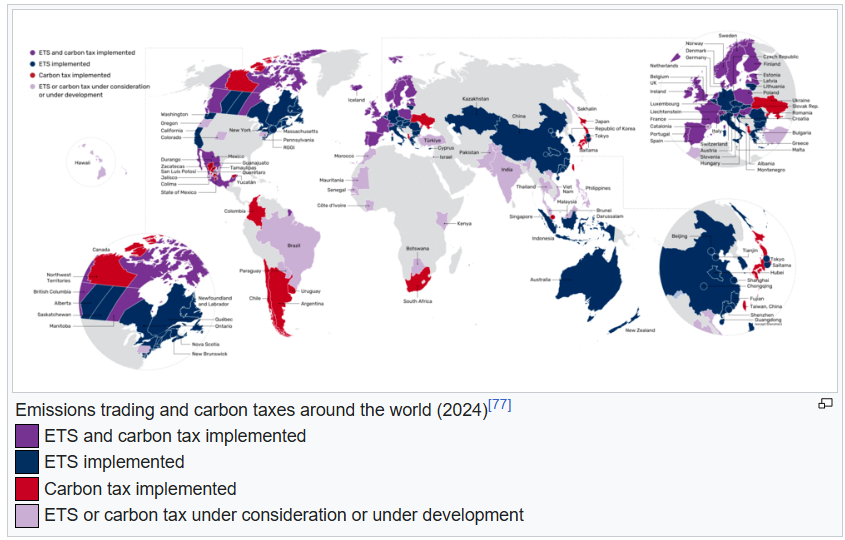
Figure 1. The countries/regions with ETS or Carbon trading systems. Source: Wikipedia.
Before comparing these actions to lower emissions with the Contrail research, we examine the various emission trading schemes currently active worldwide.
Emission trading
The base idea behind Emission Trading Systems (ETS) is that market economic mechanisms are more efficient at directing corrective actions for emissions than government directives and regulations. It requires that what’s traded has the correct composition and price.
A number of ETSs are active (Figure 1), with the most well-known being the EU’s ETS, which started in 2005, and China’s ETS, which started in 2021. ETS typically covers larger units in industries like power generation, cement, steel, housing, transport, etc.
The importance of China’s active involvement in curbing emissions is evident in Figure 2.
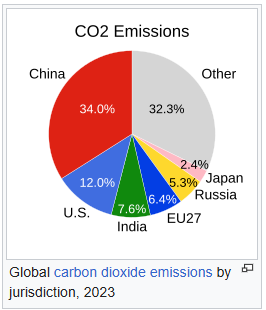
Figure 2. The 2023 CO2 emissions by country/region. Source: Wikipedia.
The ETS are Cap and Trade schemes where industries in the country/region get a specific CO2 allowance target. If an industry/company can go under the target, it can trade the excess on the ETS market, where those that can’t reach their targets have to buy allowances. The price for additional allowances are shown in Figure 3.
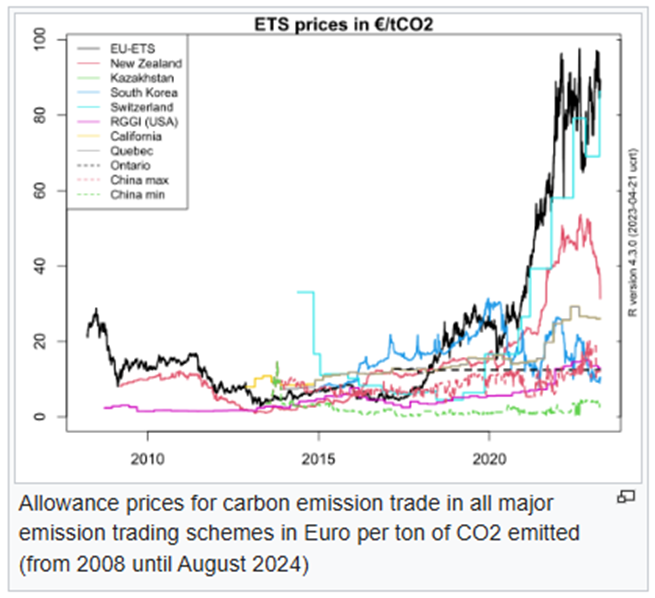
Figure 3. Emission allowance trading prices (allowance = 1 tonne of CO2) for different Emission Trading Schemes. Source: Wikipedia.
You can add allowances by investments in emission reduction technology, either in-house or in approved external projects, such as those in the 3rd world. This creates a market mechanism for emission reduction investments that does not require government involvement. There are additional rules, such as how you can save allowance from one year or period to the next, etc. The aim is not to describe the various ETSs in detail, but rather to outline the concept and mechanism behind them.
The EU ETS included the aviation sector in 2012 for intra-EU flights. Non-EU states that have joined are Norway, Iceland, and Liechtenstein. The UK has its ETS, which it is gradually linking to the EU ETS.
In the early days (Phase 1 from 2005), the EU ETS was lenient in its allowance and distributed many allowances for free to industries. The allowances per year are then gradually tightened, with allowances being trade only from 2026, and the caps being gradually reduced.
The EU ETS air transport sector’s CO2 emissions were around 50 million tonnes in 2024, of which 28 million tonnes were the sector’s ETS limit. Of these, 85% was allocated at no cost and 15% was auctioned to the sector. The reduction in allowances per year has increased from -2.2% to -4.3% to meet the EU “Green Deal” 2030 targets.
Several studies of the early phases of the EU ETS have concluded that the EU ETS has reduced CO2 emissions by 7-10 percent compared to what they would have been without the ETS.
CHINA’s ETS
The Chinese scheme is similar to the EU one, but it is still in its early stages as a national scheme. It applies to selected industries. The first industry was China’s power plants, which account for 40% of China’s emissions and thus 15% of global emissions.
The China national ETS replaces several regional and industry-specific systems that tried to curb the considerable local polluting industries in China.
Other regions
Figure 1 shows the ETS and Carbon trading systems that were active in the World in 2024. The US (except California, Washington, Oregon, and certain east coast states) and Russia are notable absentees from ETS or a carbon trading scheme.
This website provides information about the various ETS or Carbon trading schemes worldwide.
Re A220-500, I think there is no requirement to drive A220 payload-range up to A320 level. Contrary it is unnecessarily complicating the business case no one seems to be asking for. Airbus the least.
At fixed MTOW capacity boost of 5 rows/ 4m at the cost of 10% range seems a feasible way forward looking at current A220-300 usage (hardly ever > 3 hrs/ 1500nm). Operators have A320/737 series alternatives for those longer flights.
Same wings, engines, landing gear, everything -300. Two plugs. Low risk, superior CASM.
https://groups.google.com/group/aviation_innovation/attach/58e8ea931803c/Flies%20scrapbook%20NB%201.5.jpg?part=0.1&view=1
Customers decide, however it makes airliner planning life easier if it has BOS-San Diego range around 3000nm and 180 pax. A new slender wing and option on engines like a smaller RISE or a ducted fan from PWA or RR would make airline number crunchers take notice as MTOW would be way low due to less fuel load due to optimized aero and engines.
If I were Chinese, I would be quite annoyed by that.Americans gratuitously produce far more CO2 per head of population than the Chinese who create much of that CO2 generously producing cheap goods for the USA
> Cathay Pacific has entered into an agreement with Sinopec to supply SAF to Hong Kong airport to be blended and used for some Cathay flights