Leeham News and Analysis
There's more to real news than a news release.


Bjorn’s Corner: Air Transport’s route to 2050. Part 27.

By Bjorn Fehrm
June 20, 2025, ©. Leeham News: We do a Corner series about the state of developments to improve the emission situation for Air Transport. We try to understand why development has been slow.
We have examined different ways to lower global warming over the course of the series. Over the last weeks, we have summarized what practical results we can expect from the different alternatives we have to reduce global warming from Air Transport. We looked at the following:
- Alternative, lower-emission propulsion technologies.
- The industry’s typical improvement in fuel consumption over time.
- The improvements that SAF can offer by 2050.
- The different Emission Trading Schemes (ETS) that exist globally.
- Finally, what warming contrail reductions can achieve.
What role do greenhouse gases besides CO2 play?
In the list of actions to lower global warming, actions one to four are focused on CO2 emissions that are generated by the one-to-one relationship between burning fossil hydrocarbon fuels and emitting the combustion result into the atmosphere.
We know that every kilo of jet fuel produces 3.16 kilos of CO2. An area that has not received as much attention is the emission of NOx (Nitrous Oxide gases). The problem here is that there is no one-to-one relationship between jet fuel consumption and NOx emission.
The amount of NOx emissions varies with the engine’s design of its combustion process. As we have described, NOx gases are created when the combustion process exceeds a certain temperature (about 1400°C) for a minimum time.
The 2021 Lee et al. study says that the NOx global warming effect is not negligible., Figure 1.
Figure 1. The Lee et all. Study classification of the warming effect (ERF) of emissions. Source: 2021 Lee et all. Study.
The study says that about 20% of the warming effect (global ERF) can be attributed to the emission of NOx gases as a result of combustion in our air transport aircraft engines.
Modern engines undergo extensive combustor research and trials during their development phase to minimize NOx emissions. ICAO requires all engine manufacturers to submit their engine test stand results for fuel consumption and emissions of greenhouse gases. The results of these tests are published in the ICAO Emission Databank, which is hosted on the EASA site here.
There are airports in the world that charge visiting airliners for their emission. These use the ICAO databank emission values. The ICAO emission databank lists emission values for CO2, CO, and NOx. It also publishes a Smoke number for the engine.
The databank lists the emissions for each engine when run at different thrust levels at a test stand. There are also emission data from what is called Takeoff, Climbout, Approach, and Idle in the databank. The values are measured at different trust settings, enabling an airport emission calculation for a Landing and Takeoff cycle, called the LTO cycle. Here is how the calculation is described for NOx emissions:
NOx LTO Total mass (g) = The total mass of oxides of nitrogen emitted during the LTO cycle (sum of time in mode x fuel flow x EI at each of the four power settings), where EI is the emission index for the greenhouse gas.
The thrust and time values are: Takeoff 100% 0.7 minutes, Climbout 85% 2.2 minutes, Approach 30% 4.0 minutes, Idle 7% 26 minutes. The LTO value for e.g. the 737-800 engine is NOx LTO Total mass (g): 5331 grams or 5.331kg.
We can’t use the ICAO emission database for estimating the effect of global NOx emissions, as it doesn’t give a cruise value. Instead, we must use the Lee study to understand the warming effect of NOx emissions.
The calculated value of total warming effects in Figure 2 is a 20% average value of the total warming effect. As we can’t compile the NOx emissions from all the world’s aircraft flying every day (about 25,000), we will use the relationship between CO2 and NOx as shown in Figure 2 to calculate a CO2e equivalent for the NOx emissions.
The updated table is shown in Figure 2. We can see that the total emissions go from 734 million tonnes of CO2 to 1154 million tonnes of CO2 and CO2e.
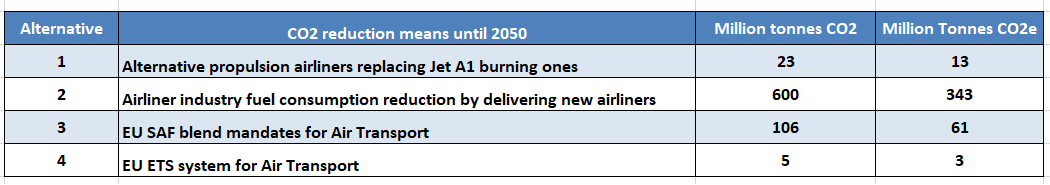
Figure 2. Greenhouse gas emission table with NOx added.
With the updated table, we are now ready to examine the warming effect of greenhouse gas emissions and compare it with the warming effects from contrails in the next Corner.
Seems like NOX and contrails will be the easiest targets. The latest engine designs have very low NOX levels and by limit the older models time in service will help reduce emissions and noise. Just as done several times before on noise and emissions. Getting ATC routines to have traffic avoid contrail formation altitudes/routs is harder du to a split- and political- system.