Leeham News and Analysis
There's more to real news than a news release.


Bjorn’s Corner: Sustainable Air Transport. Part 41. VTOL mission calculations.

By Bjorn Fehrm.
October 14, 2022, ©. Leeham News: Last week, we defined the phases of an eVTOL mission that shall show us the typical range and endurance of the eVTOLs of a hybrid vectored thrust/lift and cruise eVTOL, similar to a Vertical VX4, Figure 1.
Several parts of the energy consumption calculations are complex, and surprisingly it’s not the vertical parts. We go through why and how we calculate the energy consumed for the mission.
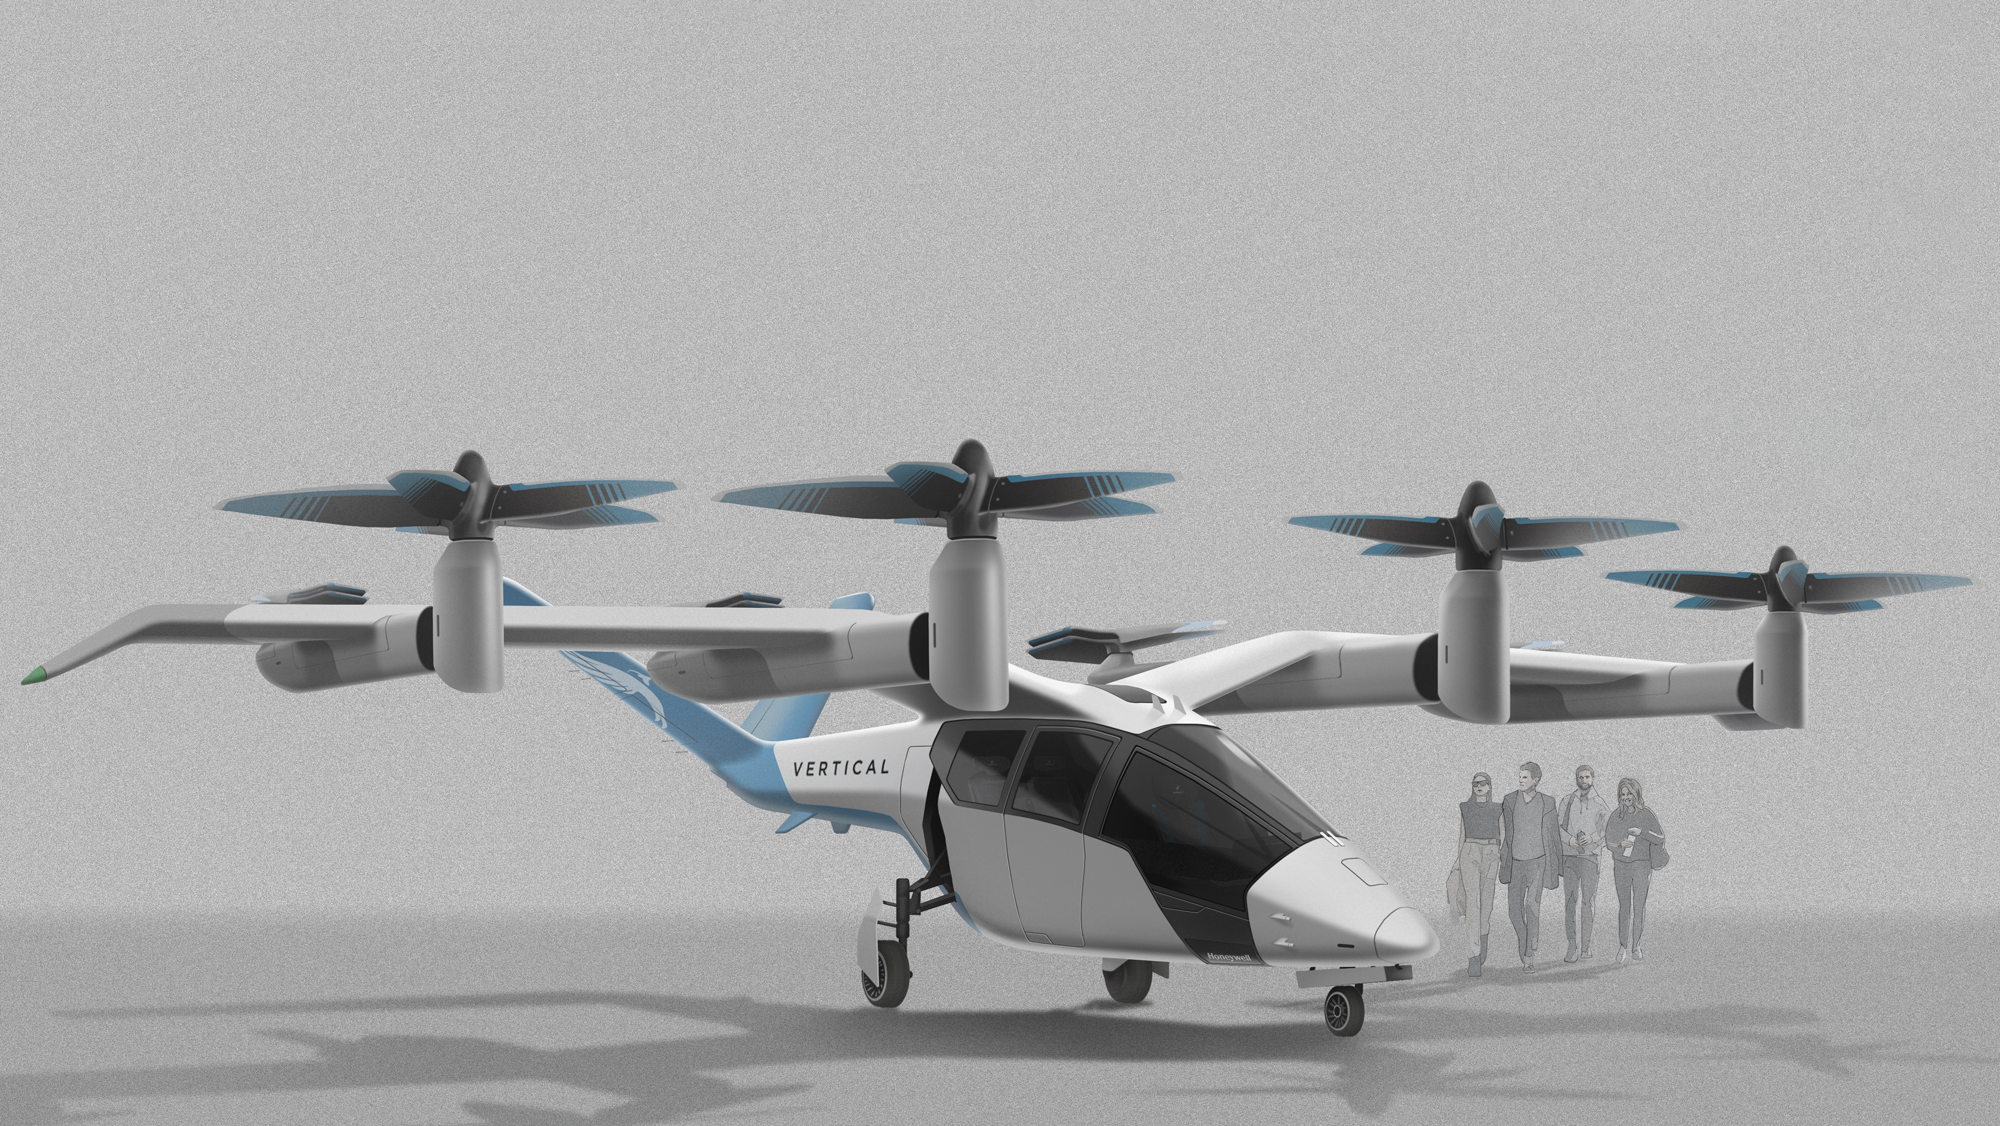
Figure 1. The Vertical Aerospace VX4 in an early rendering with similar looks to the eVTOL we discuss. Source: Vertical Aerospace.
eVTOL mission calculations
The typical mission we defined last week is shown in Figure 2, with some additional data regarding each phase.
 Here is how we fly the mission phases, their energy consumption calculations, and problem areas;
- Vertical takeoff to 300ft: The vertical takeoff for an eVTOL is straightforward to calculate. You use the disc loading formula to calculate the power needed at the aircraft level, times the hover time of 20 seconds. Then, you get the battery energy draw by multiplying it with the chain’s efficiency losses. You have losses in the battery (internal resistance that generates heat), the inverter, the electric motors, and the rotor. Chain efficiency is 70% during hover. It includes blocking losses for the rotor booms. It would be wrong to calculate with a brand-new battery as this is seldom the case in the eVTOLs life (brand new and after battery refurbishment/renewal). We chose the 90% State Of Charge (SOC), which is the midpoint SOC between a new battery’s full charge level at 100% SOC and the full charge level of a worn-down battery at 80% SOC which is normally the point at which an operator decides to refurbish/renew the battery.
- The transition to forward flight at constant altitude: The transition from zero speed to a deeply stalled eVTOL, then to the stall region, and finally, forward speed of 1.3 times stall speed (the usual definition of margin kept to stall for normal flight) is the most tricky phase of the mission. It’s, therefore, done in horizontal flight. The acceleration from zero speed to 1.3 times stall speed is done with 0.2G’s acceleration, which gives the transition time. We assume the clean stall speed to be 80kts. The average chain efficiency is 72%.
- The climb to Top Of Climb (TOC) at a cruise altitude of 8,000ft for long missions or 5,000ft for 20-minute missions is done at 110kts. Chain efficiency is 73%. See below for the calculation problematic of climb, cruise, and descent energy consumption.
- Cruise at 130kts to Top Of Descent (TOD). Projects talk of “speeds up to 200mph” ( 170kts). But the eVTOL will be energy constrained, and the more SOC that can be left in the battery at the end of the mission, the shorter the recharging time and less wear on the battery. We, therefore, use 130kts as cruise speed. Chain efficiency is 75%.
- At TOD, we descend with cruise speed at a sink rate of 800ft/min to 2,000ft, where the approach procedure to the landing pad commences. We assume a flight from a downtown heliport to a feeder airport helipad. You will be required to follow a specific approach procedure also in VFR conditions; therefore, we assume a 3° approach at 130kts to Decision Height (DH) which is 600ft. From there, it’s either a flight to transition/vertical land or a divert to an alternate in IFR below minimum conditions. Descent and approach efficiency 76%
- Speed and efficiency data for transition and vertical as before, with the vertical land taking 45 seconds. The power drawn from the battery is high at hover, and it shall be finished at a SOC level where the battery can deliver this C-rate. We assume a minimum SOC of 10%, getting us 80% SOC to use in the mission.
- Mission reserves as discussed; 20 minutes in VFR conditions, alternate plus 30 minutes flight for IFR conditions. If we need an alternate, we look at the effects of a 30nm, 60nm, and 100nm alternate.
Climb, Cruise, and Descent energy consumption
If it wasn’t for the influence on the eVTOL drag of the 4+4 rotors, the calculation of energy consumption in these phases would be straightforward. Thrust is vehicle drag with the added effect of a change in potential energy at climb and descent.
As Energy is Force times Distance, if we know the thrust used, we can calculate energy consumption per nautical mile.
Calculating the basic parasitic and induced drag of a vehicle like ours is straightforward. But then we have the influence of the rotors. We have four tractor rotors that behave like the propellers of the C-130, Figure 3. A swirling propwash will impinge on the boom, wing, and fixed rear rotors.
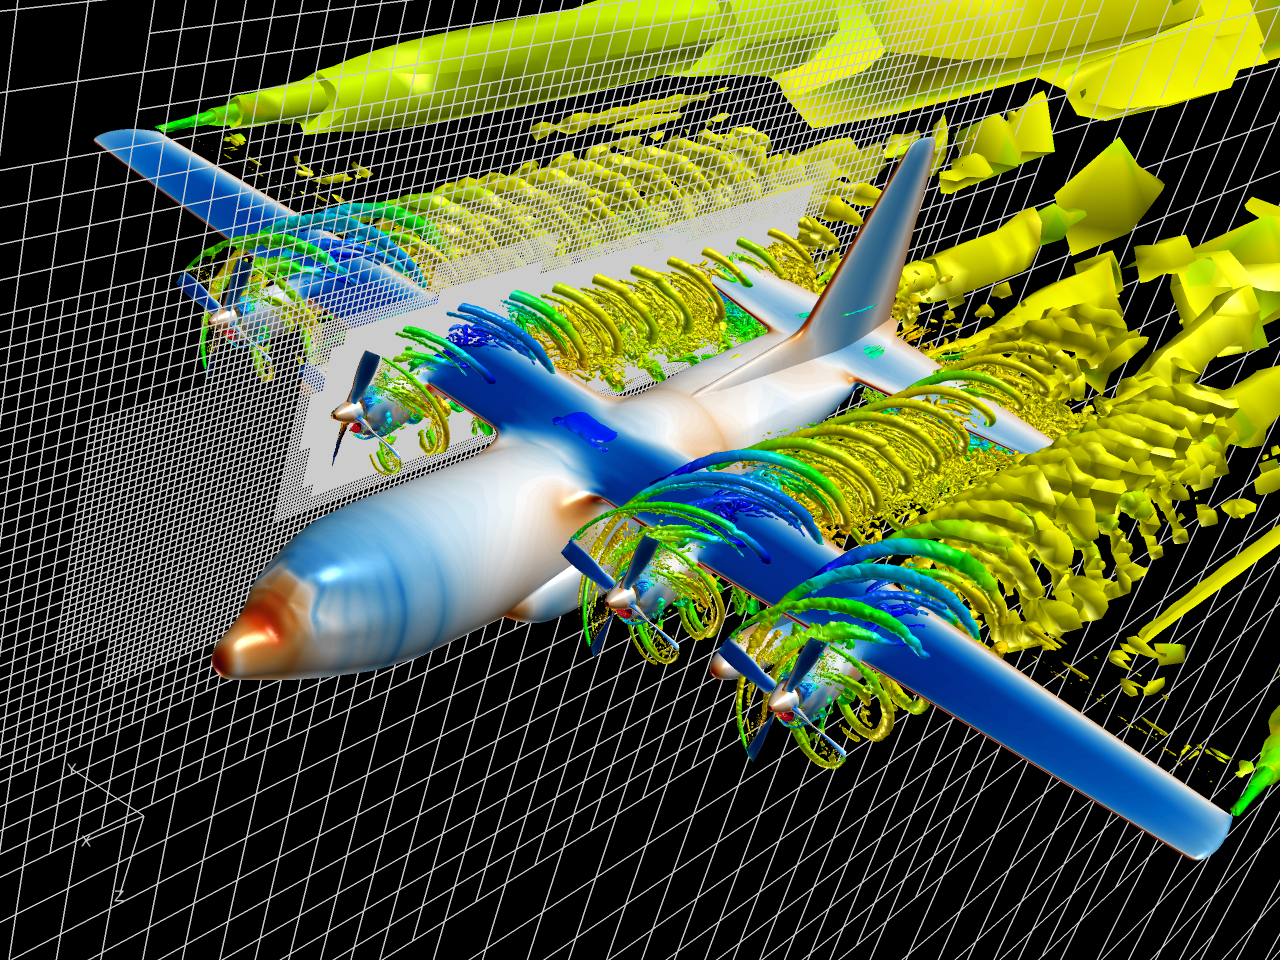
Figure 3. CFD simulation of the propwash of a C-130 Hercules. Source: Aerocat08 in Reddit Aviation.
The added drag is difficult to assess, especially what happens around the rear fixed rotors. We use drag data I have from prop aircraft with similar configurations to estimate this drag delta. This is where projects can have some surprises.
Next week we look at the resulting energy consumption for the different phases and what it means for the range of the eVTOL in different operational scenarios.
Would be nice to see payload/range in pure aircraft mode with required field lengths as well as mixed operation of vertical city helipad start but horizontal landing at city airport UAM runway.
Sure, we can do that.
A nomagram can be a beautifully clear and powerful thing but they can take a while to create. I imagine a payload versus range graph with several curves for different battery mass fractions or MTOW?
Maybe vertical take-off and transition can be skipped, to save battery energy.
https://youtu.be/b1_ADVlUZ2Q?t=21. Not sure if all passengers would be ready for this & installing launch equipment on rooftops & helipads might be challenging.
Joking aside I’m curious to see what the energy calculations & estimations Bjorn will be adding up will do to required battery capacity for a 400kg payload for such a vehicle.. Investors should be too.
You can do the numbers and add the benefits from: 1) Using the altitude loss allowed from the helipad to gain speed 2) Using a high voltage power chord for the first 100′ of the T-O designing some engines with dual Voltage motors lke +/-270VDC and 5-15kV A/C (higher voltage = smaller engine for same power). 3) T-O against the wind direction by rotating the helipad. Ideally these helipads should be at the end of multi lane highways in the cities allowing for a straight climb out and easier emergency landings. We will see what EASA/FAA suggests for city UAM helipads.
I understand the calcs for preliminary and ballpark, but in the end just like Boeing or Airbus, you just test it and measure the fuel flows (battery use) in this case and get the real world data.
Your design should give you some margin to add batteries to achieve a goal (or accept your goal is too much and reduce it but that of course depends on any customers and contracts if any)
The designs are weight constrained. The max limit for an eVTOL is 3175kg, and all the manufacturers are struggling with getting a large enough fraction of that to energy (battery system). So it’s not a matter of adding battery modules unless something else gives, like passengers. In a fuel aircraft, you have a trade space between payload and fuel as you can fly a full house but then only fill the tanks too, say, 60%. With batteries, they are always at 100% mass: at idle, takeoff, and landing. No flexibility.
Well, in order to trade ‘fuel’ for payload, one could have removable battery modules.
Another point is, with conventional Pt 23 airplanes, critical performance data like takeoff and climb are required to be calculated with ‘minimum’ (i. e. ready for overhaul) engines. Cruise can be done with average engine performance.
Thanks, but the engine, in this case, the electric motors have negligible deterioration; it’s the energy source that degrades. For takeoff an 80% SOC battery has no influence. For landing the allocation including the cutoff for hover (10% SOC) is the same, it’s the range that suffers (the only flexible part of the mission). I will include the effect of an 80% battery, good idea.
Wouldn’t an 80% SOC have implications for peak power delivery (and thus take-off)? It’s not only total capacity that degrades in batteries but also maximum current.