Leeham News and Analysis
There's more to real news than a news release.


Airline Passenger Experience: PEDs, in-flight entertainment, expanding services
Stowage and Retention of PEDs: The US government shutdown will delay rules from the Federal Aviation Administration on the trend toward allowing gate-to-gate use of Personal Entertainment Devices, or PEDs. A special FAA committee sent its recommendations to the FAA on Sept. 30, the day before government operations ground to a halt for non-essential services due to the budget impasse in Congress.
The possibility of allowing expansion of the use of PEDs came up at the Aircraft Interiors Expo-US organized by Reed Exhibitions (Flight Global). We attended on behalf of APEX, the Airline Passenger Experience magazine, and filed several stories with APEX.
Here is one on the PED issue, and the factors that must be considered for the stowage and, more importantly, retention of PEDs. What’s the difference? Stowage is just that. Retention is keeping the PED where it is stowed in the event of an emergency (aka, crash) so the PEDs don’t become flying objects.
Embedded IFE or Bring Your Own? With the proliferation of Bring Your Own Devices (BYOD), the question arises: how long will airlines continue to embed in-flight entertainment systems, and how long with OEMs provide them?
This was one of the questions raised at the Aircraft Interiors Expo in Seattle this week. Here is a story on the subject we did for APEX magazine. Don’t look for embedded IFE to disappear any time soon, and not for reasons you would think.
Expanding passenger experience: Airlines are trying to alter the in-cabin passenger experience (not always for the better, in our view, but we digress). It’s not that easy, given regulations, different vendors and more. Industry experts answered questions about the challenges of integrating in-flight entertainment systems into aircraft. The event was the Aircraft Interiors Expo-US by Reed Publishing. We recorded a couple of short segments that give the flavor of the challenges.
http://www.youtube.com/watch?v=Kv0tvZCX6Aw
L to R: Jose Pavida, VP Engineering, TIMCO; Zuzana Hrnkova, Head of Aircraft Interiors Marketing, Airbus; Alan Wan, Product Manager, Thales; Sage Secimis, Electrical Engineering Manager, Northwest Aerospace Technologies.
http://www.youtube.com/watch?v=ItpYCdmwyb4
Recordings by Scott Hamilton
United’s new effort for airline passenger exerience comfort
United Airlines announced it is adopting a new seat in coach to improve the passenger experience.
Its press release is here.
UAL’s overview:
The new design includes:
- Bold elements, such as multi-tonal leather seat covers, distinctive double-stitch patterns, sculpted contouring and a new United-branded tag
- More ergonomic and supportive cushioning and additional seat-back storage space in United Economy Plus and United Economy
- Technology that makes the seats more environmentally friendly by reducing seat weight and volume, contributing to less fuel burn
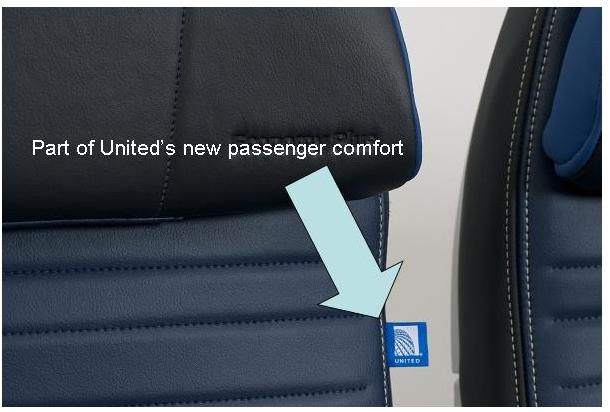
We’re impressed.
Ultra Long Range Airplane market will limit 777-8 sales
A limited global market for Ultra Long Range Airplanes (ULRA) will limit sales of the Boeing 777-8.
The Boeing Board of Directors is expected to green-light the 777X program this month, with two versions of the airplane: the 350-passenger 777-8 and the 406-passenger 777-9. The 777-8 will have a range of about 9,400nm and the -9 a range about 1,000nm less.
The 777-8, an Ultra-Long Range Aircraft, is known within the industry as “Tim Clark’s airplane.” Clark is the president of Emirates Airlines and for years has been urging Airbus and Boeing to develop a plane with ultra-long range that can fly from Dubai to Los Angeles with a full payload. The absence of this ability is one reason why he has not purchased the 747-8I.
Reaction to the 777-8X in customer meetings sponsored by Boeing has been tepid. The 777-8X has been viewed as a niche airplane that will not compete effectively against the Airbus A350-1000, which nominally carriers 350 passengers but has a range of about 8,400nm.
Customer reaction, we are told by some of those in attendance at these meetings, has been that the 8X is a highly niche aircraft that will be needed on only 5% of the world’s routes. It will be too heavy and too costly for most operations, and uncompetitive with the A350-1000.
Inslee proposes extending 787 tax credits for 777X, but they were ruled illegal in WTO case
Washington Gov. Jay Inslee has proposed extending the state tax credits to Boeing as an incentive to land the assembly of the 777X.
The Puget Sound Business Journal has this report.
The Seattle Times is a bit more detailed.
Here is the Governor’s speech (17 pages) with the details.
Inslee predicted quick approval by the State Legislature, which returns to session in January.
The tax breaks were those granted to Boeing to land the assembly of what was then known as the 7E7, later renamed the 787.
There is one little issue, however. The 787 tax breaks were found to be illegal under World Trade Organization rules in the highly contentious international trade dispute between Airbus (the European Union) and Boeing (the US Trade Representative) over illegal subsidies.
The WTO found Airbus and Boeing each received illegal subsidies or tax breaks, and Boeing’s from Washington State were among those found to be illegal.
The US and EU each appealed the respective WTO rulings.
We asked the director of the Governor’s Office of Aerospace about this. His reply:
“The case is still being adjudicated and they are still in effect. Until something changes, the industry is still benefiting.”
Odds and Ends: Contrary views of Mulally; Cathay considers 420-seat 777-9X; Long haul flight log; a walk in the park
Contrary views of Mulally: With increasing media speculation about the prospect of Alan Mulally returning to Seattle to take the helm of Microsoft, a company in need of strong and creative leadership, two interesting and contrary views of the former CEO of Boeing Commercial Airplanes emerged.
The first we’ll put up is from Steve Wilhelm at the Puget Sound Business Journal, who wrote this piece recalling Mulally. The second is an old Business Week article that is considerably less flattering.
Mulally was passed over to head The Boeing Co. twice. After the second time, he left to become CEO of Ford Motor Co., saving it from bankruptcy (rivals GM and Chrysler didn’t avoid this fate), and remaking it into a profitable entity.
Many at Boeing believe that had Mulally stayed, many of the problems that emerged from the 787 program would have been avoided. This is, of course, a matter of speculation, but there is no getting around that his successor, Scott Carson, as a finance expert and salesman, didn’t have the engineering background necessary to cope with the emerging debacle of the 787 and 747-8 programs.
Microsoft has been stagnant under the tepid leadership of Steve Ballmer. Mulally, at 67, is old by CEO standards, but he certainly would shake things up at the stodgy company.
A retrospective New York Times article talks with Mulally and looks at Boeing in May 2006. Four months later, Mulally was CEO of Ford.
Cathay considers 420-seat 777-9X: Cathay Pacific Airways is considering becoming a launch customer for the Boeing 777X, reports Aspire Aviation. The configuration considered is a 420-seat version. Aspire cites an internal CX newsletter.
We noted on September 10 that Air Canada is jamming in 458 seats in a Boeing 777-300ER. The 777-9X is somewhat larger so it’s obvious CX won’t be using a similar seat pitch or business/first class size as Air Canada. But at 420 seats, this, too, is solidly within the Very Large Aircraft sector. (Boeing insists the 777-9X is not a VLA, however.)
As with the Air Canada -300ER, and as we have written many times, the -9X makes the 747-8I irrelevant and, in our view, represents the final nail in the coffin of the poor-selling 747-8I. The 9X in an Air Canada configuration probably would easily push 450 seats, becoming a clear threat to the Airbus A380. We think this is why Airbus began touting 11 abreast coach seating for the dual-deck airplane, adding 40 seats to the capacity. So far as we know, no airline has bought into this concept.
The VLA market was fragmenting already with the current generation of aircraft (777, A330, 787 and soon the A350). It will shrink further with the 777-9X.
Airbus had maintained a consistent 20-year forecast of about 1,200-1,300 VLA passenger models since it launched the A380 in 2000. Boeing has reduced its forecast to a mere 540 VLAPs. Airbus released its latest 20 year forecast on September 24 in a press conference in London that continues to predict the same number of VLAs over the next 20 years. We’re already 13 years into the original Airbus 20 year forecast for VLAs, and the figure hasn’t changed much since then (in fact, it’s gone up slightly).
As we wrote way back in July, the A380 continues to struggle.
Long Haul Flight Log: This is priceless. And accurate. Hat tip to Mary Kirby.
An Aside: We often take our Golden Retriever to Soaring Eagle Park in King County for a hike. One morning this week, we came across this scene of backlit morning sun, some fall colors and a spider web (center of the picture). This Blackberry photo doesn’t do the scene justice, but we thought we’d share this example of Mother Nature’s work anyway.

Photo by Scott Hamilton
Airbus announces 68 A320s, A333 “Lite” at Chinese air show
Airbus loves air shows as platforms for announcements, and the current event in China is no exception.
Airbus announced orders for 68 A320ceos and neos and launched the A330-300 Lite program (though no orders yet). Reports suggest Airbus expects the first Lite orders from China, hence the location and announcement at the air show.
Zhejiang Long Airlines signed an MOU for 11 ceos and 9 neos. This is a start-up carrier.
Qingdao Airlines ordered five ceos and 18 neos.
BOC Aviation, the long-established leasing company owned by the Bank of China, placed an order for 12 neos and 13 ceos.
The A333 has a range of 3,000nm and will carry about 400 passengers. The weight is 200 tons and Airbus says it will burn 15% less fuel than the all-up, 6,100nm version. Aviation Week has some additional detail.
Separately, Bloomberg reports that Vietjet (Vietnam) will order up to 100 A320 family airplanes. The order could be announced today, Bloomberg says.
- We’ve not commented on the Lufthansa Airlines order for Airbus A350-900s and Boeing 777-9s to any great extent because the deal was pretty straight-forward. But this Aviation Week article has a comment from the LH CEO saying it by-passed the 787-10 because its range (at 7,000nm) is to short. This is interesting in context of Boeing’s statements that the 787-10 will cover about 90% of the mission requirements of airlines. Just an observation.